To see the interactive versions of these charts, head over to our blog. If you’re inclined to share, here is the link: http://blog.plot.ly/post/99540799397/seven-climate-and-population-charts-past-present
The recent UN Climate Summit and People’s Climate March drew attention to — you guessed it — the climate. Here are a few choice interactive graphs about the climate, global population, public opinion, and more. Click through to the sources to learn more. To sign-up, embed, and make your own interactive charts, check out our tutorials.
Long-Term Cumulative Emissions from Fossil-Fuel and Cement
Let’s start with a historical perspective; the United States and Europe are responsible for nearly 50% of carbon emissions from fossil fuels and cement since 1870. However, read on to see why this can be complicated.

Past, Present & Future of The Global Carbon Budget
This plot tracks the global carbon budget, or “the balance of the exchanges (incomes and losses) of carbon between the carbon reservoirs or between one specific loop.” According to this chart, if the rate of emission stays constant, the remaining carbon budget would be used up in about 30 years.

Global Per Capita CO2 Emissions
And on the subject of emissions, China’s per capita emissions have now passed the EU28. U.S. emissions are still well above that. But as Plotly Co-founder and Harvard University Environmental Fellow Alex Johnson notes, the chart also raises questions.
This is such an interesting plot, but it begs so many more questions! One of the things I’d love to see, if the data is available, is the same data broken into residential (personal) / commercial / industrial use. This would help get at questions like how valid is China’s assertion that the west is outsourcing its emissions to China, and where does the US most need to cut back to be on par even with Europe.

Global Population Projection
Public opinion may vary, but scientists agree that (1) the Earth’s climate is warming and (2) that it is extremely likely that humans are causing most of the changes. At the same time, the world’s population is also changing. This chart shows the population figures the U.S. Census Department has tracked and projected.

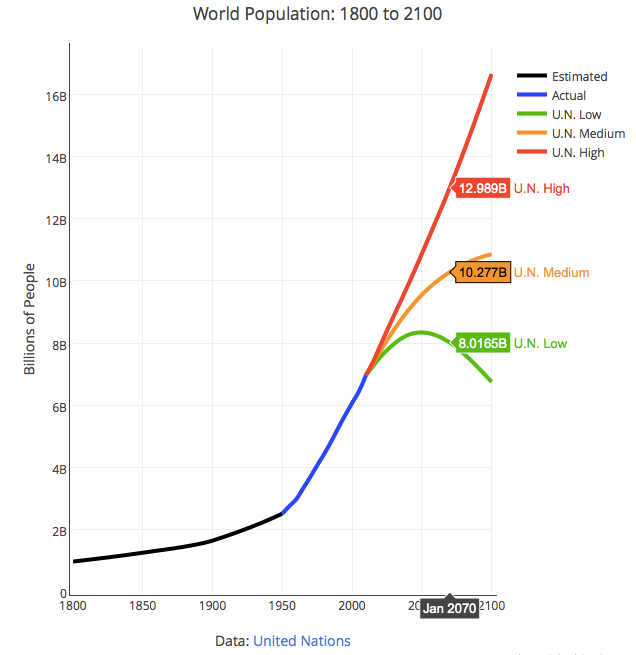
Global Population Possibilities
The UN has also projected various outcomes for global population. The U.S. National Academy of Sciences and Royal Society of London do not underestimate the complex challenges that lie ahead.
It is not prudent to rely on science and technology alone to solve problems created by rapid population growth, wasteful resource consumption and harmful human practices.
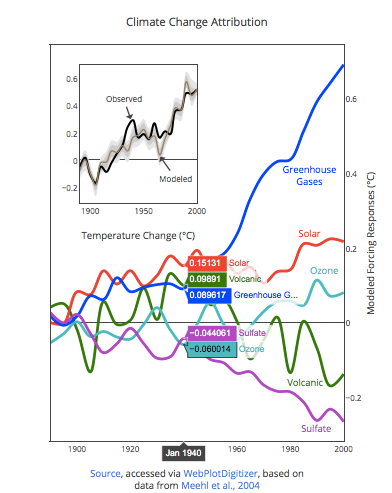
Climate Change Attribution
Yet to understand and explain our climate, population, and the world, we need science, technology, and collaboration. The graph below is a thoughtful example. The chart shows a global climate model
tuned to reconstruct the historical temperature record and the corresponding assumptions in the model to which the associated temperature changes can be decomposed into various forcing factors.
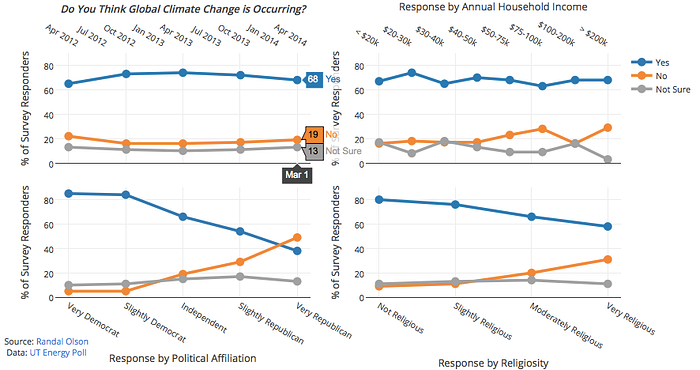
Do You Think Global Climate Change is Occurring?
So what do people think about the issues? The UT Energy Poll tracks climate change opinions. Blogger Randy Olson graphed and discussed the data:
Despite the continuous raging debate, the average American’s acceptance of global climate change hasn’t really budged in the past 2 years. Income and educational attainment have no effect whatsoever on whether someone accepts that climate change is occurring or not.
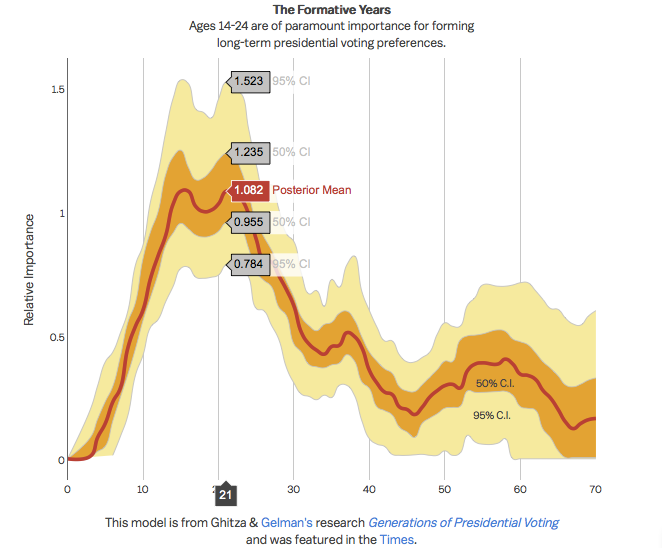
Political Opinions
So what does impact our beliefs? The graph below describes when our presidential voting preferences are most influenced. Events that occur between the ages of 14–24 are most impactful. Thus, the events of today will likely be informative for the voting patterns and political preferences of the next generations of voters, shaping how we might ultimately grapple with these issues.